STEM hiring has turned, and it is leading the market
STEM job postings rose 25% year over year in September, 24 points ahead of a flat US market. Eleven straight months of gains, every sector up. What the turn means for a STEM career center, and the one comparison to make this quarter.
Alexey Gutin
Co-founder & CEO
Share this post
STEM postings are up 25% year over year, 24 points ahead of the market.
For most of the last three years, STEM career centers were selling into a shrinking market. That is no longer the case, and the shift is worth a close look.
The decline was real, and most of it was the market
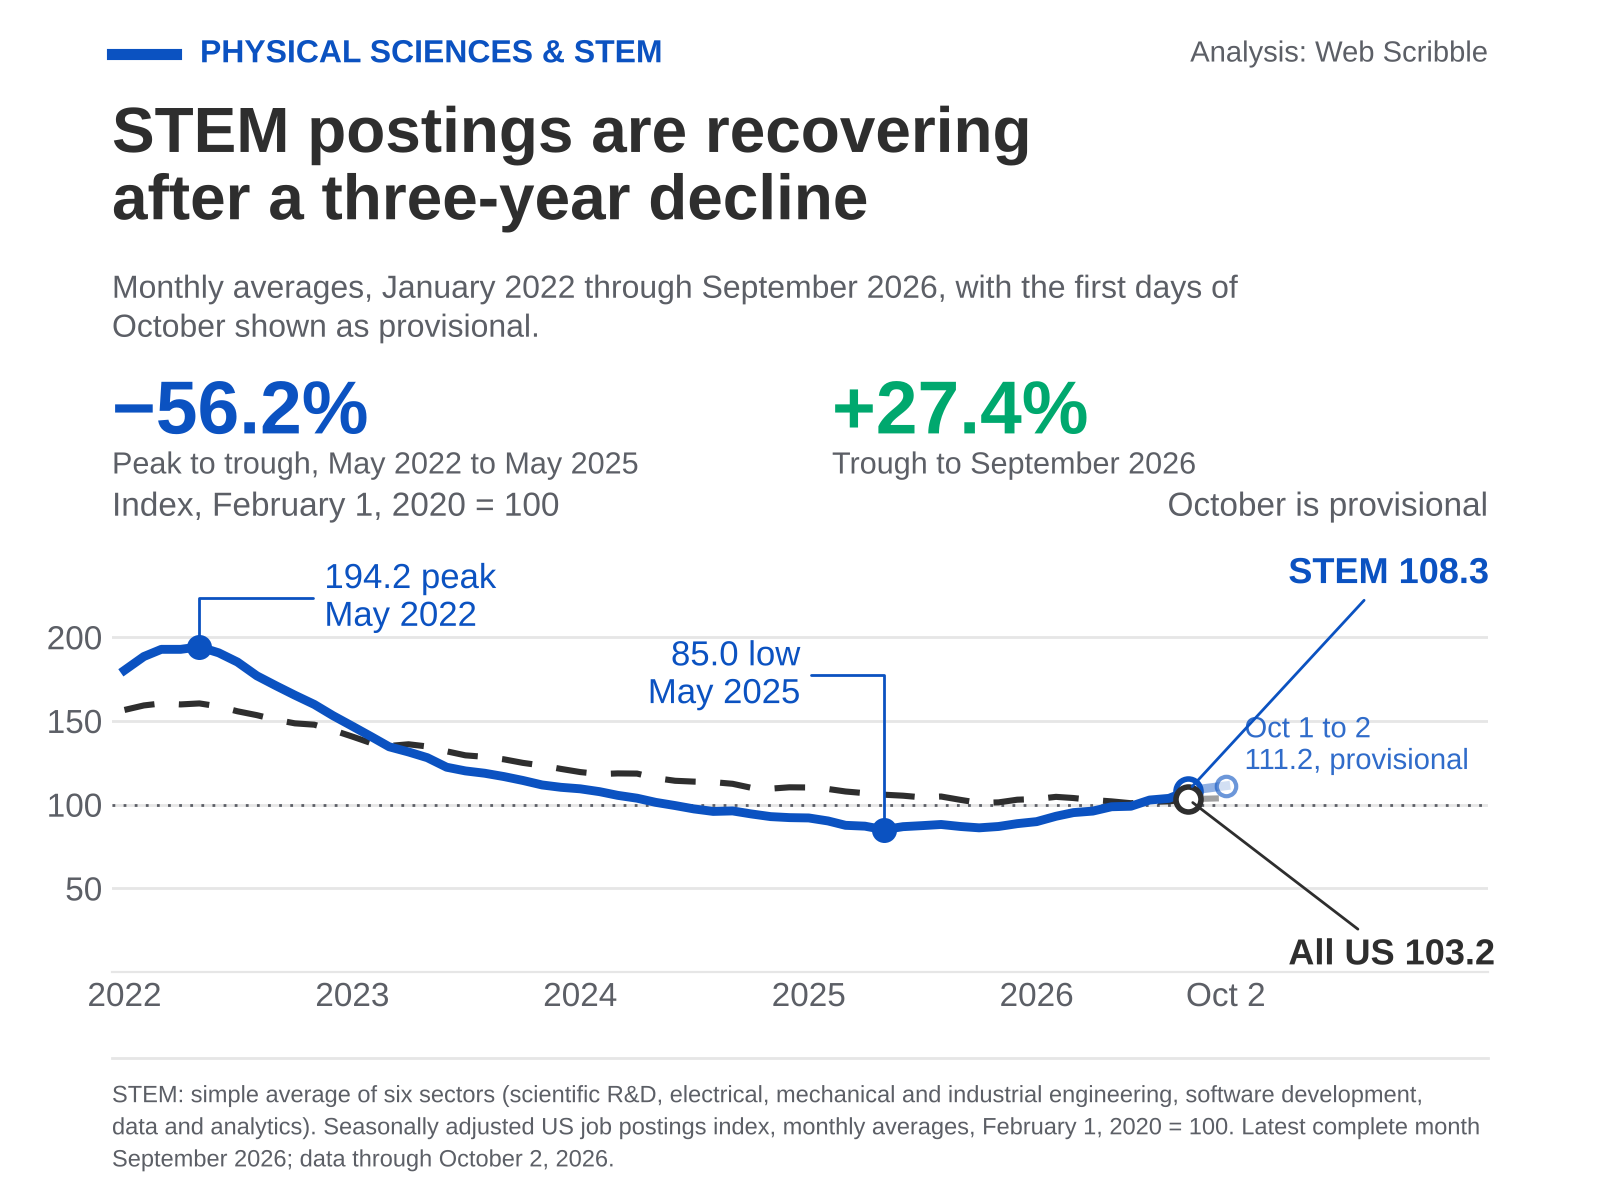
Postings for physical sciences and STEM roles fell hard after 2022. Our composite of six Indeed sectors peaked at 194 in May 2022. It bottomed at 85 in May 2025, a fall of 56%. Scientific research and development postings fell 63% over the same stretch. Software development postings fell 73%, the steepest drop in the group. Every association with a STEM career center felt that in job board revenue. Most of them read it as a career center problem. The data says the market did most of the damage.
STEM postings are recovering after a three-year decline. Index, February 1, 2020 = 100. Source: Indeed Hiring Lab Job Postings Index, US, seasonally adjusted; analysis by Web Scribble.
The market has moved since then
The composite has risen for eleven consecutive months, November 2025 through September 2026. It now sits 27% above its low, at 108 on the index. September postings were 25% higher than in September 2025. All US postings were up 0.4% over the same window. That puts STEM 24 points ahead of the overall market. September was also the first year-over-year gain for all US postings since October 2022. STEM crossed that line in February and has stayed above it since.
The numbers for the year to date tell the same story. January through September, STEM postings ran 12% above the same months of 2025. All US postings ran 3% below the same months of 2025. The turn is nine months old, not one strong month.
Every sector in the composite is up
Mechanical engineering postings lead the group at 37% year over year. Industrial engineering is up 33% and electrical engineering is up 23%. Software development is up 19%, and scientific research and development is up 18%. Data and analytics is the laggard at 4%, still positive. The recovery is uneven in one way that matters for employer sales. Mechanical and electrical engineering postings sit well above their February 2020 level. Software, research and data postings are still below it. Employers are adding engineers faster than they are adding researchers and analysts.
Every STEM sector is up year over year. The overall market is flat. Source: Indeed Hiring Lab, September 2026 vs September 2025; analysis by Web Scribble.
Who is hiring right now
A market index tells you how much hiring there is, not who is doing it. The market behind those postings is a large one. About 10.9 million people work in STEM occupations in the United States. The Bureau of Labor Statistics expects that number to grow 7.4% by 2035. That is twice the growth it projects for all occupations. Thousands of employers hire into that market, from aerospace and defense primes to instrument makers.
Here is one example of what that demand looks like at the employer level. We track open roles on the careers pages of some large employers in these fields. In October 2026, Boeing alone had about 3,800 open STEM roles. Leidos had about 2,300 on the same day. Corning, Texas Instruments and ManTech each had roughly 550 to 600. That counts engineering, science, software, data and IT titles only. These are examples, not a measure of the market. Many of the largest STEM employers are not on that list at all. In our experience, employers like these hire physicists and materials scientists under engineering titles. Few of them find an association career center on their own. That is the employer universe a STEM career center should be selling to.
Two things are worth knowing about those counts. They are a snapshot of open roles on one day, not a trend. And they are examples, so the market total is many times larger.
10.9 million people work in STEM occupations in the US, and large employers are hiring right now. Open engineering, science, software, data and IT roles, counted on each employer's own careers page in October 2026; twelve large employers shown as examples, not a measure of the market. Workforce size: BLS, 2025.
Why this matters for an association
A career center sells into a hiring market it does not control. When postings fall, job board revenue falls with them. When postings recover, a passive job board does not recover on its own. In our experience, employers return to job boards that sell, not ones that wait. So the useful measure now is the gap between the market and your job board. The market number for September is a 25% gain. Your career center's number is in your own employer revenue report.
Declining demand, or declining penetration?
These are different problems, and they have different fixes. Demand shows up in public data like the Indeed index. Penetration shows up only in your own employer revenue. Our view is that most STEM job boards do not have a demand problem today. If revenue is flat while postings are up 25%, hiring employers are posting elsewhere. That is a sales problem, and sales problems respond to effort.
2026 is the first annual gain for STEM postings since 2022. Annual averages; 2026 is January to September. A reading of 98 means STEM postings this year average 2% below their February 2020 level; September alone was 108. Source: Indeed Hiring Lab; analysis by Web Scribble.
What the data says, and what it does not
The index counts job postings on Indeed, not hires and not revenue. Every reading is relative to February 2020, so 108 is a level, not a count. Our employer count fills the other gap: who is hiring, and how many roles. Neither source changes the direction of the last eleven months. In our experience, postings move first, hires follow, and job board revenue follows hires. A job board that waits for revenue to confirm the turn will be late.
Three things to check this quarter
First, put your job board's year-over-year employer revenue next to the 25% market number. One comparison tells you which of the two problems you have. Second, look at which sectors your posting employers come from. Engineering employers are hiring fastest, and a research-heavy employer list will miss them. The employers above are examples, not the whole market. Third, plan employer sales against the market, not against last year. A job board that grew 5% in a market that grew 25% lost ground.
The market just handed STEM career centers a tailwind. The next twelve months decide who uses it.
Want your job board's year-over-year number next to the market's? Talk with our team.
Source: Indeed Hiring Lab Job Postings Index, US, seasonally adjusted, 7-day trailing average, indexed to Feb 1 2020 = 100. Monthly averages; September 2026 complete, data through October 2, 2026. October 2026 has two days of data and is excluded; year over year compares September 1 to 30 in both years. STEM composite is the simple average of six sectors: Scientific Research & Development, Electrical Engineering, Mechanical Engineering, Industrial Engineering, Software Development, Data & Analytics. The index measures job postings on Indeed, not hires. github.com/hiring-lab/job_postings_tracker.
Employer openings: Web Scribble's own count of open STEM roles on the careers pages of large aerospace, defense and materials employers it tracks, counted in October 2026. STEM roles are job titles in engineering, science, software, data or IT; manufacturing, trades, operations and business titles are excluded. The list is a set of examples, not a sample of the market; many of the largest STEM employers are not on it. A one-day count, not a trend. STEM employment: U.S. Bureau of Labor Statistics, Employment Projections, Table 1.11, employment in STEM occupations, 2025 and projected 2035.
Share this post
Put your job board next to the market
Get your career center's year-over-year employer number next to the 25% STEM market number, on one page.